5 Reasons Why Your Papers Should Have Graphical Abstracts
As you most probably know from your own experience, scientists are overwhelmed by their work. From the first day of the PhD studies, you have to constantly follow literature, do your research, and communicate through papers and conferences. Once your career advances, you will also have to apply for funding and patents, hire and manage people, teach and mentor students and so on. Therefore, when you are preparing any scientific communication, you should consider the readers: they are most probably busy, overworked and tired, just like you. The communication method you use has to help them understand the main message effortlessly.
When people who are interested in your research open your journal paper, they want to quickly learn the main message. Most scientists only quickly skim the papers before they decide to dedicate hours reading them carefully, word by word. Drawing in science is very much undervalued by the community, however, it is one of the best methods for quickly explaining your research. And at the pinnacle of all science-related drawings are graphical abstracts. Here are 5 reasons why you should create graphical abstracts for your scientific journal papers:
1. Graphical abstracts convey your message most effectively
A graphical abstract most commonly appears at the beginning of the paper, right below the title and affiliations. The title, abstract, and graphical abstract together help the reader understand the main message of the paper quickly allowing them to decide whether they are interested in reading the whole paper. When prepared correctly, they can be read almost intuitively and can hold much more information than the amount of text that can be read in the same time.
2. Graphical abstract will draw attention to your paper in search results
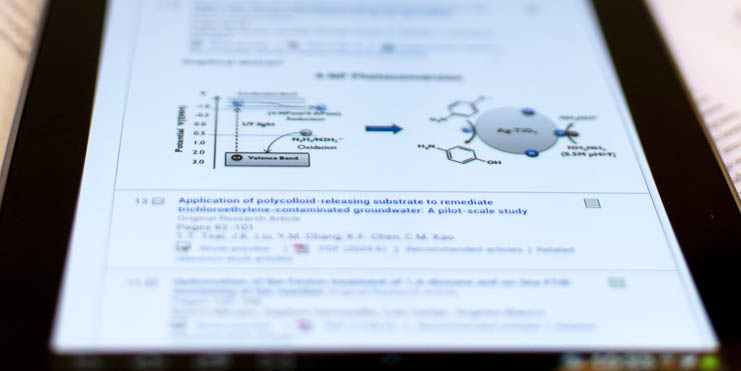
Some of the most important search engines are starting to include the graphical abstracts besides paper titles. As we have learned in the post on how scientists read journal papers, our eyes stop at images. This means that your paper will more likely catch the interest of the potential reader if it appears in search results together with a well crafted graphical abstract which reveals the main message. Less important, but still relevant, the papers with graphical abstracts take up more space in the search results.
3. Scientific journals use graphical abstracts to promote your paper
If a journal gives you an option to provide a graphical abstract, they will most probably be using it to promote your paper. They are your ally: if your paper gets attention, their journal gets attention. If your paper gets cited, their journal gets cited. This means that you should always grasp any promotion opportunity the journal staff presents you. Including creating a graphical abstract, video abstract etc.
4. Once created, a graphical abstract can be used in posters and slide presentations
Create once, use often. There is a high probability that certain scientific topic will be with you for a long period of time. Once you create a graphical abstracts, you will be able to include it into a slide presentation or a conference poster. Even more, all individual elements/illustrations you create can be reused in the future graphical abstracts or any other research figures.
5. Graphical abstracts follow the contemporary trend of “short sharp science”
The number of figures in the research paper should be minimized to the most essential ones (think about the word count that figures add to your text!). Only key figures should be put in the manuscript, the rest should be provided in the supporting material, and everything should be rounded up with a visual summary – the graphical abstract.
[social_warfare]

Jernej Zupanc (PhD in Computer Science, 2011) is the founder of Seyens Education Institute. He is an evaluator of H2020 project proposals and a published photographer.


Add comment or question?